High throughput sequencing has increasingly become adopted in clinical practice and population genetics (PopGen) studies, shifting the challenge from obtaining access to the technology to extracting the most from the data generated in an efficient yet accurate manner. With its comprehensive offering, the Illumina DRAGEN (Dynamic Read Analysis for GENomics) Bio-IT platform is able to call small and large variants with high precision and high speed, thus enabling efficient delivery of meaningful insights, all within a single platform.
The New York Genome Center’s release of high-coverage whole genome sequencing data for the 1000 Genomes Project1 allows us to contextualize these various callers within a representative cohort. This allows us to not only observe variant calls from many diverse samples, but also to hone in on regions where coverage data is non-uniform or violates the assumptions of our variant callers.
Here we deployed the DRAGEN platform on the 1000 Genomes Project data and:
- Identified small and large variants, aggregated and publicly available.2
- Showed, through examples, the variety of insights provided by DRAGEN for investigating larger variants.
- Took advantage of DRAGEN’s high accuracy and filtering capabilities on cohort samples in order to flag small variants that are potential artifacts or violate Mendelian assumptions. Flagged variants are also publicly available.3
I) DRAGEN Speed and Variant Callers used on the 1000 Genomes Project Dataset
The DRAGEN platform features multiple pipelines that are used in conjunction in order to call small and large variants with high accuracy from a cohort sampling. Table 1 describes the DRAGEN pipelines available for variant calling.
Table 1. DRAGEN Pipelines Used for 1000 Genomes Project Analysis
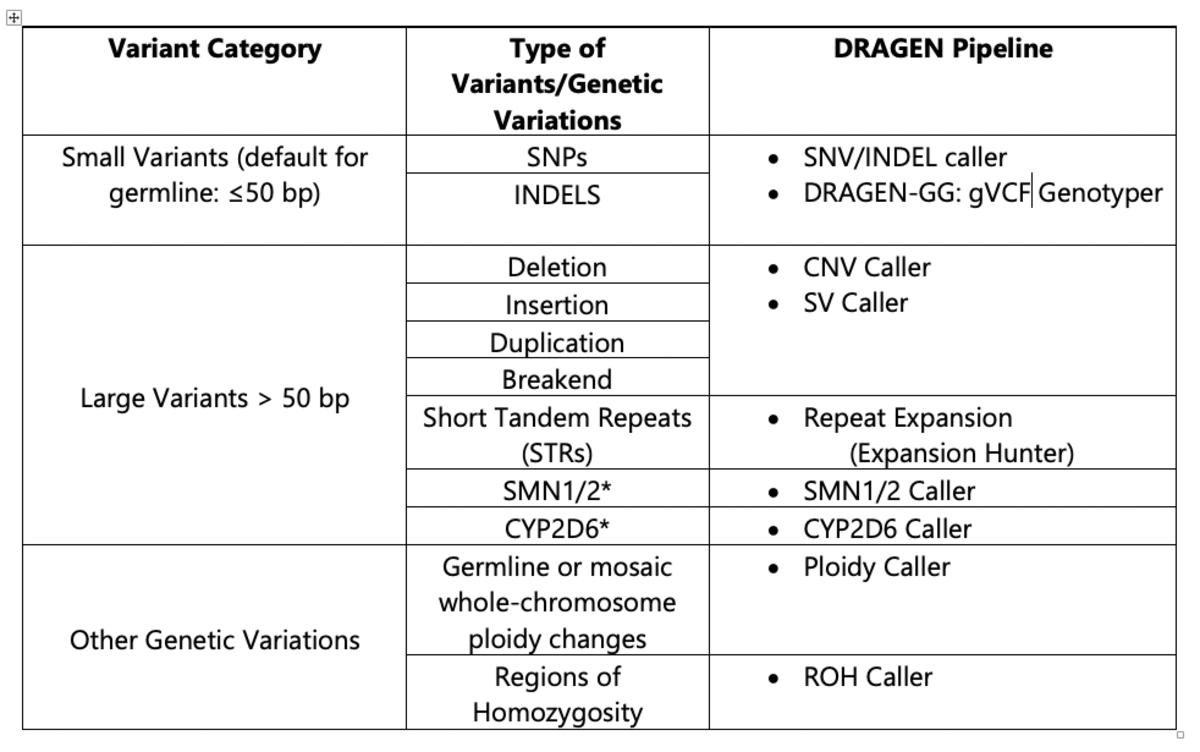
*The CYP2D64,5 and SMN 1/26,7 pipelines were not included in the current analysis of the 1000 Genomes Project dataset using v3.5.7b, but are available in DRAGEN v.3.7 (CYP2D6) and DRAGEN v.3.8 (SMN1/2).
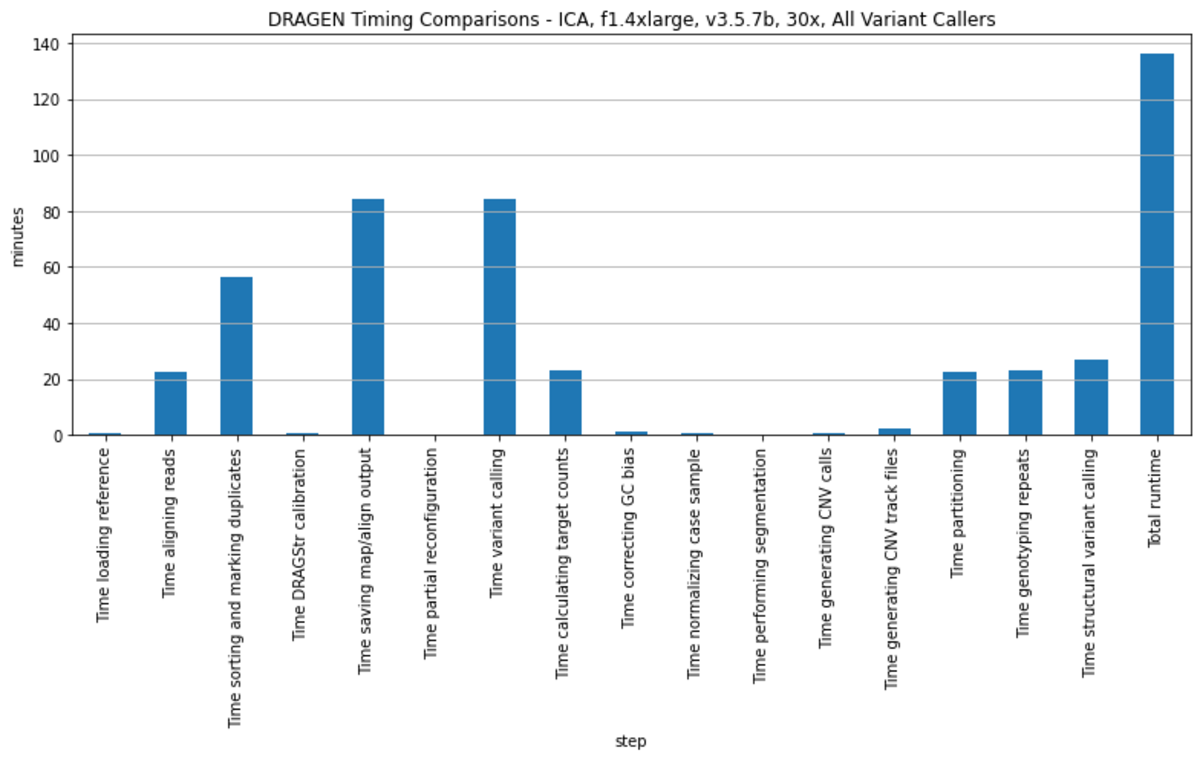
For the 1000 Genomes Project dataset analysis, all pipelines used were orchestrated via a single DRAGEN command and deployed in a single end-to-end run for each sample. To provide an example of DRAGEN’s high processing speed, Table 2 and Figure 1 show the average of the run times on 2504 samples from the analysis performed with DRAGEN v3.5.7b on the Illumina Connected Analytics8 cloud computing platform utilizing f1.4xlarge AWS instances.
Table 2. Average Run Times for DRAGEN v3.5.7b on ICA (f1.4xlarge instance)
(n=2504, reference: hg38 alt aware)
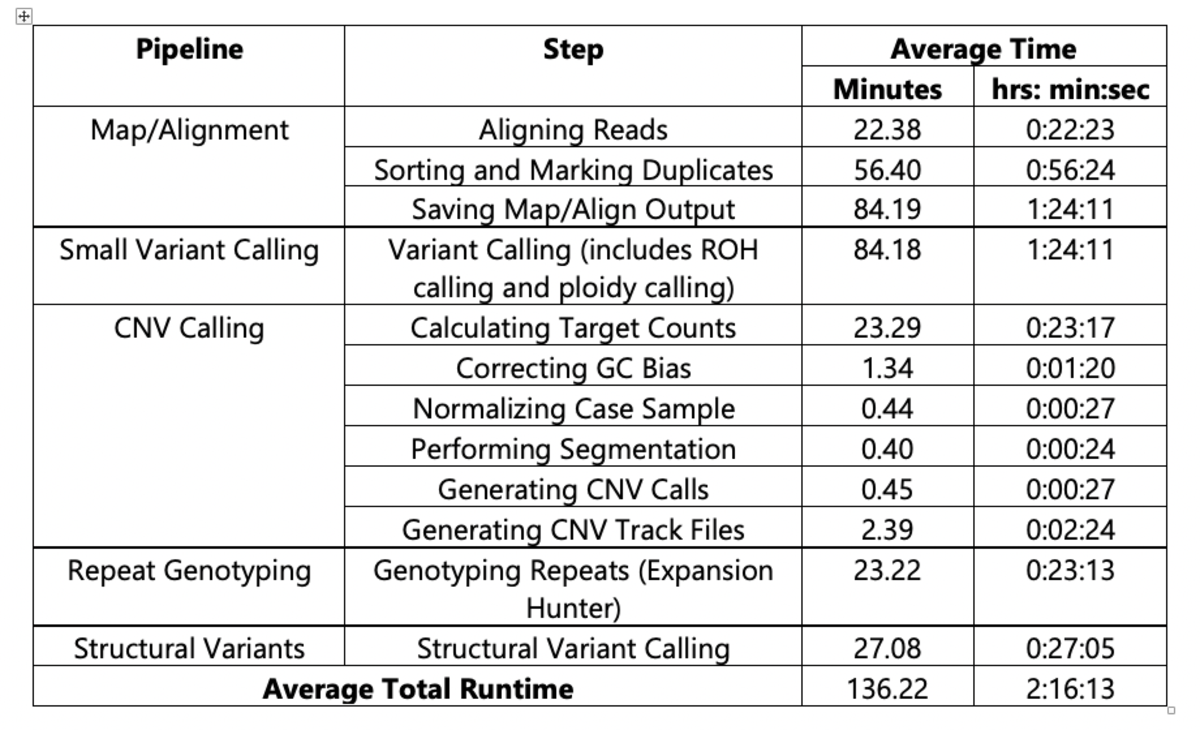
DRAGEN runs performed using different genomic references, larger AWS instances (e.g., f1.16xlarge) or on an on-premise DRAGEN server can result in faster analysis run times. Run time improvements may also be obtained with newer DRAGEN software versions.9
II) Additional Insights into the DRAGEN Pipelines Used for Large Variant Calling on the 1000 Genomes Project Data
A structural variant (SV) is a large genomic variation found in an individual’s genomic DNA relative to a reference sequence. Although less frequent than small nucleotide variants (SNVs), these large variations can disrupt the function of a gene and their implications in diseases have been documented.10
In order to identify all of the different types of large variants, the DRAGEN platform incorporates multiple tools used in tandem to glean insight into the structure of an individual's genome. DRAGEN employs complementary approaches using read-depth, split- and paired-read information, and bespoke algorithms targeted at known genomic loci.
In this article, we show how the DRAGEN-SV caller is used in combination with other DRAGEN pipelines in order to call subtypes of SVs such as Copy Number Variations (CNVs). We also describe how DRAGEN deploys targeted approaches in order to call variants in difficult-to-call regions (e.g., using Expansion Hunter for STRs, CYP2D6 caller for variants in the gene encoding for the Cytochrome P450 2D6 enzyme, and SMN1 and 2 callers for variants in the survival motor neuron genes that play a role in spinal muscular atrophy).
DRAGEN SV Caller
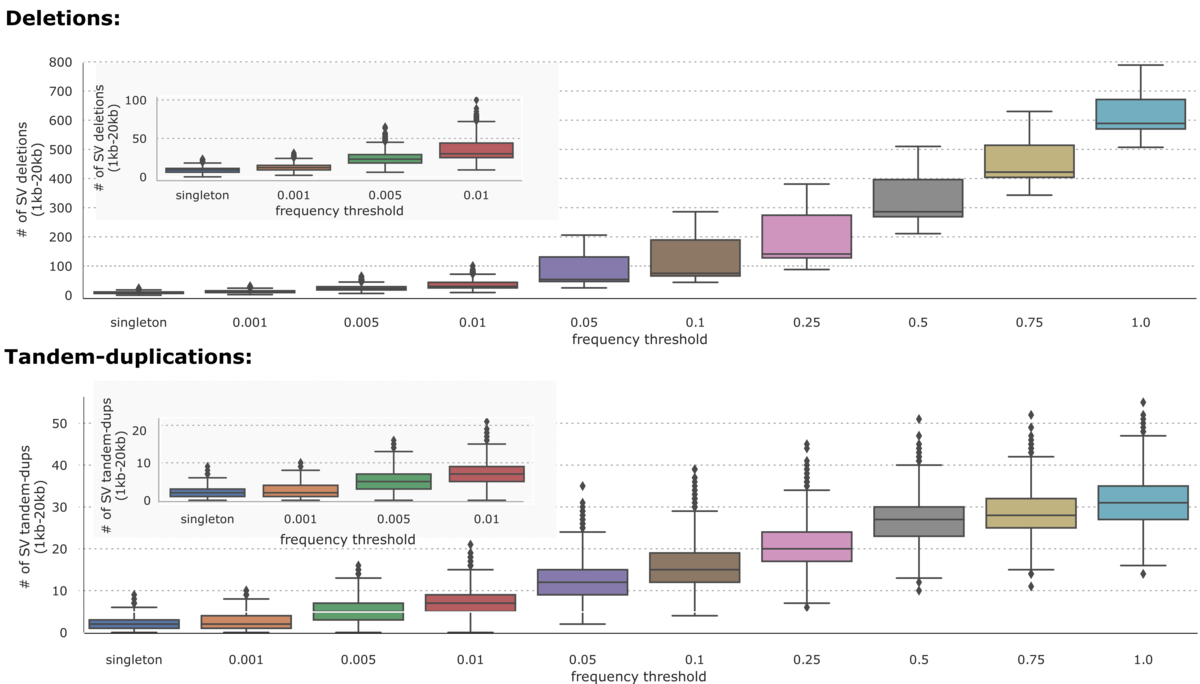
The DRAGEN SV caller is derived from the open-source Manta SV caller.11 Like Manta, it leverages both split and paired-read evidence to discover and score structural variants including deletions, insertions, tandem duplication and breakends. By convention, structural variants are reported down to 50bp in size. For deletions and tandem duplications 200 bases and larger, the SV caller additionally asserts that the depth change between the variant and its flanking regions is consistent with the variant type, further improving the precision for these variant types.
On the 1000 Genomes Project dataset (n=2504), the DRAGEN-SV pipeline was able to call 36961 unique deletions (1kb-20kb) and 7534 unique Tandem-duplications (1kb-20kb) distributed across different frequency thresholds as shown in Figure 2.
DRAGEN CNV Caller
The DRAGEN CNV caller uses a depth-based approach to segment the genome into regions of contiguous germline copy numbers. This operates under the germline assumption and is thus not tailored towards detection of mosaic variants (although high-purity mosaic CNVs may be reported by the CNV caller’s output VCF file). A rule of thumb is that this caller has very good performance on variants 10kb and larger for a 30x genome, but this roughly scales with depth of coverage. A genomic CNV that is very large may be represented in the CNV caller, and also be reflected in a ploidy change on its source chromosome. Additionally, we may see a CNV represented in the DRAGEN-CNV caller, as well as the DRAGEN-SV caller if it has split or paired-read support in addition to depth-based support.
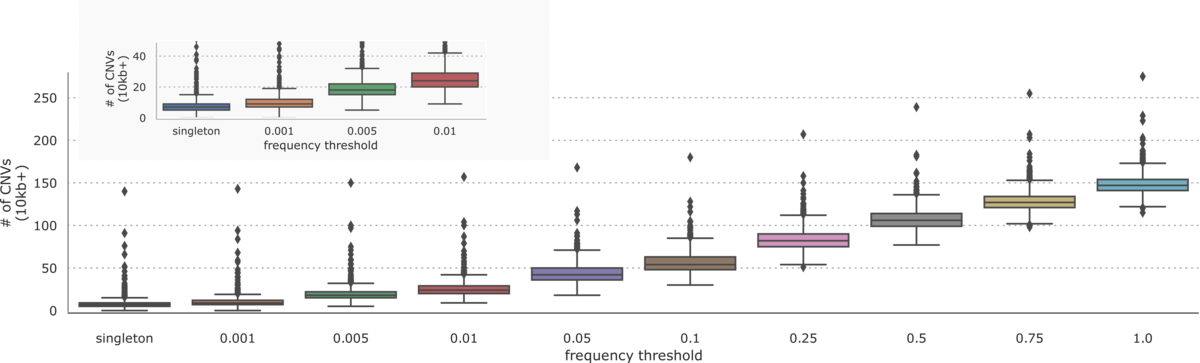
On the 1000 Genomes Project dataset, the DRAGEN CNV pipeline was able to call 2891 unique CNVs greater than 10kb in size with a frequency distribution described in Figure 3.
Aggregating CNVs across samples, we see about 150 calls per sample greater than 10kb in size. As with small variants, we note that many CNVs are very common with about 25 variants remaining at a 1% frequency threshold and 6 singleton variants per sample.
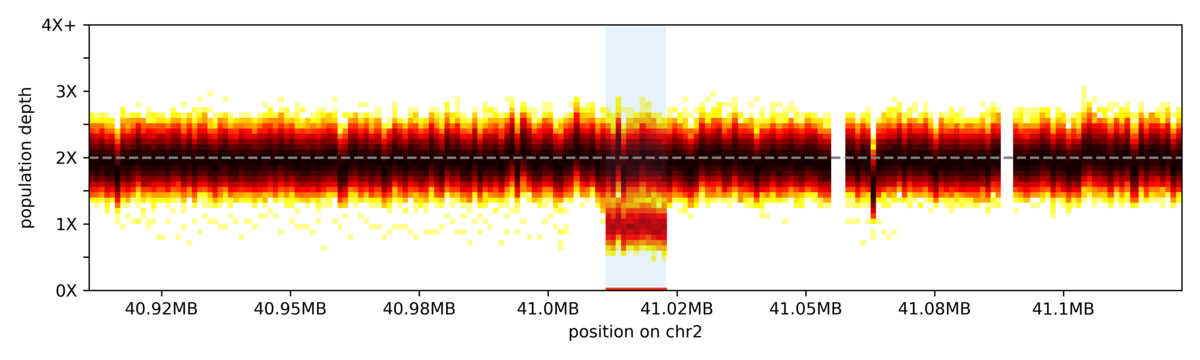
The vertical slices in the heatmap represent coverage bins, and intensity of colour for each slice represents the distribution of sample depth of coverage across the 1000 genomes cohort for that given bin. The highlighted region indicates the coordinates for a common deletion.
DRAGEN ExpansionHunter
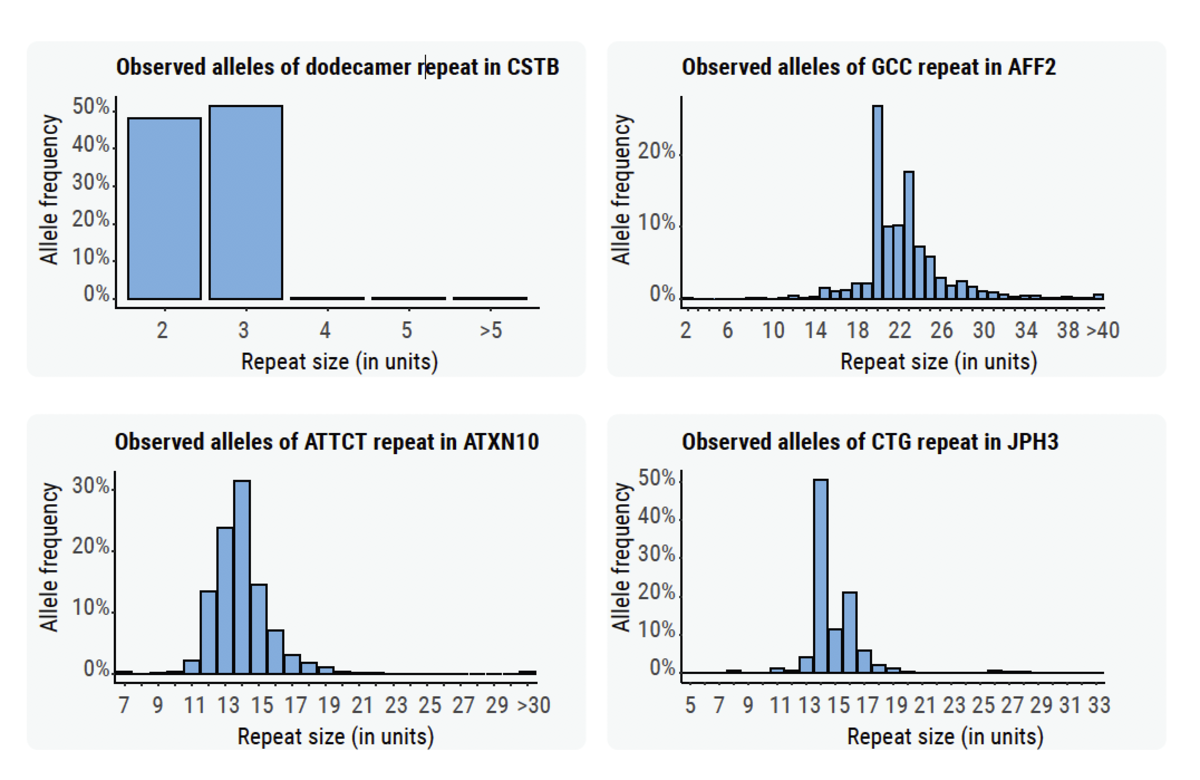
STRs/Repeat expansions are a special class of insertion variants where the inserted sequence comprises additional copies of a repeating motif. Due to the methodology of SV calling (relying on de-novo assembly of inserted sequence), this remains a difficult class of variants to call. Despite this, the DRAGEN platform can employ prior knowledge of the variant structure to accurately call repeat expansions using sequence graphs (ExpansionHunter).12,13,14 The DRAGEN team has curated clinically relevant repeat expansions from the genetics literature and includes reporting of most known repeat expansions as part of this variant calling package.
We generated size distributions for some STRs across samples from the 1000 Genome Project (Figure 5).
DRAGEN Ploidy Caller
In many pathologies, shifts from baseline ploidy can be observed, and the DRAGEN ploidy caller reports average ploidy levels for all autosomes and sex chromosomes. This caller is capable of reporting germline whole-chromosome ploidy changes or mosaic variants down to about 15% mosaic purity. These changes are observed via their DNA copy number and may or may not be considered structural variants in the narrow sense (many refer to them as constitutional changes) but are included in this discussion as they can be lumped in with SVs in a practical interpretation sense.
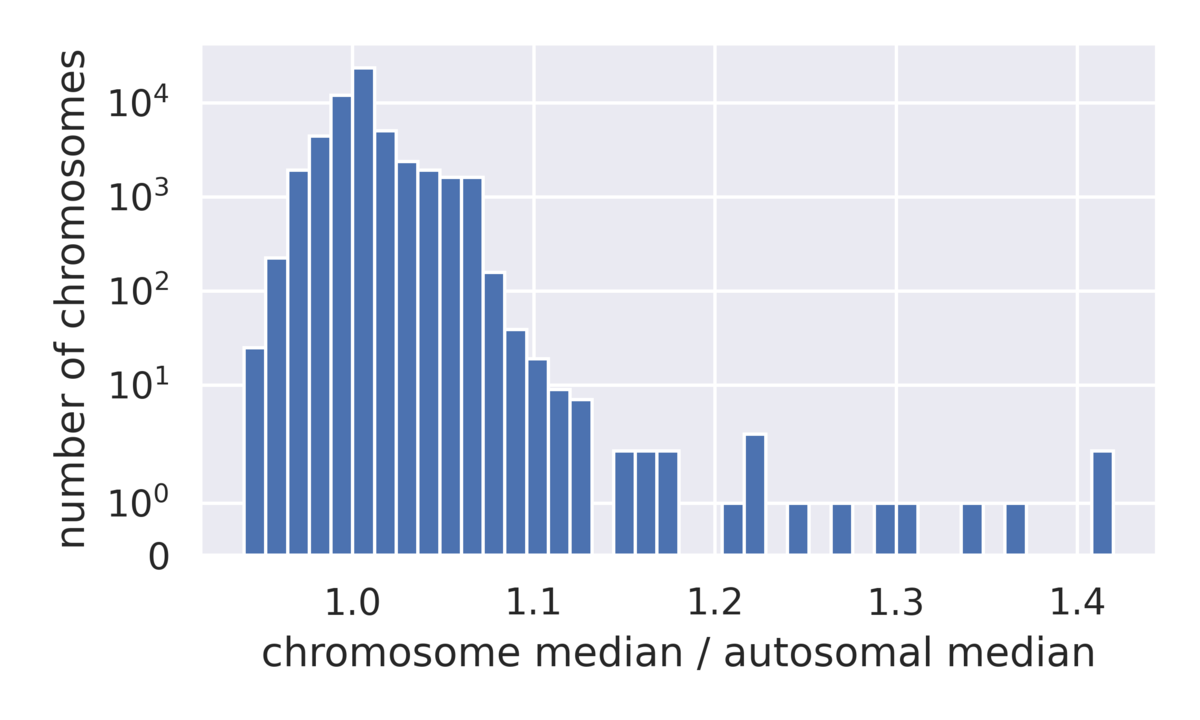
We can use the 1000 Genomes data to examine the distribution of ploidy calls across a diverse array of samples (Figure 6), allowing us to better understand the detection limit of whole chromosome ploidy changes in a way that is not feasible in traditional benchmarking datasets often consisting of less than a handful of samples. Evaluation of the chromosome coverage across this pool of samples allows us to see that the vast majority of chromosomes lie between 90% and 110% of the expected coverage, while a small number of outliers have gains in coverage.
DRAGEN ROH Caller
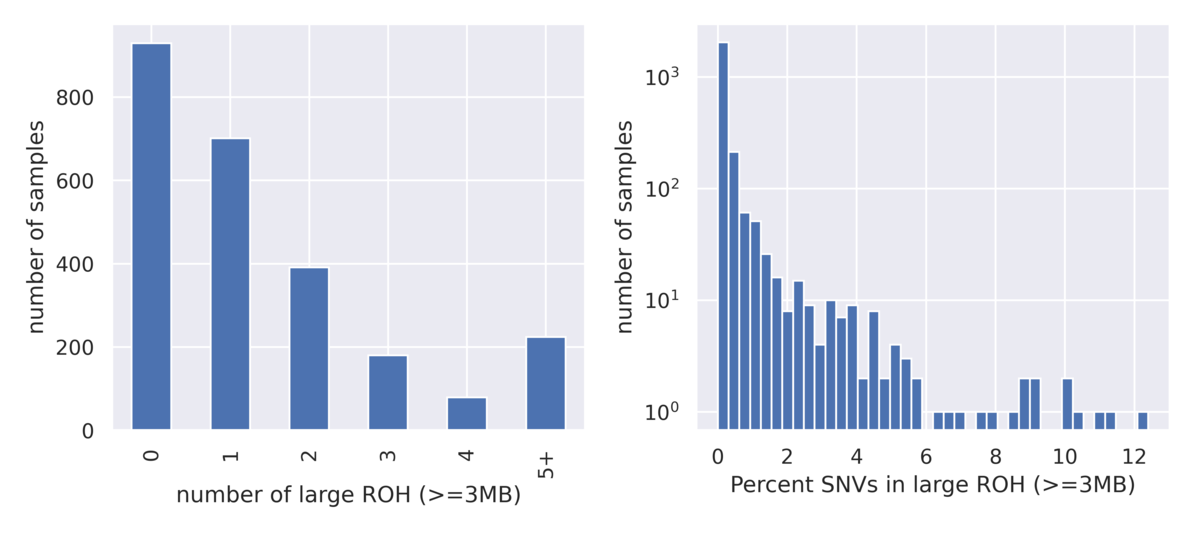
DRAGEN also supports calling large runs of homozygosity (ROH). This caller operates on small variant genotype data and highlights regions where a number of homozygous variants appear enriched over heterozygous variants. Large ROH calls can be used to highlight the presence of uniparental isodisomy or relatedness among parents. Due to natural variation of ROH across the population, the 1000 Genomes Project dataset is very instructive for setting baseline expectations of ROH blocks in a typical population and can be used to set heuristic thresholds for flagging clinical cases as abnormal for further investigation (Figure 7).
III) Combining Multiple Data Types Using the DRAGEN Platform: unbalanced translocation example
The breadth of the 1000 Genomes Project dataset allows us to observe a diversity of rare types of variation not available to standard benchmarking samples. One example is an unbalanced translocation seen in NA20533. These types of large-scale genomic rearrangements are very rare and nearly always pathogenic when observed in clinical samples. In this example, we suspect that the unbalanced translocation is a somatic cell line artifact. Nonetheless, we can use it as an example of a clinically relevant variant type.
Looking at the ploidy caller output, we see an outlier chromosome warranting further investigation:
PLOIDY ESTIMATION,,Autosomal median coverage,36.47
...
PLOIDY ESTIMATION,,13 median / Autosomal median,1.24
...
For this example, we use DRAGEN’s `target.counts.gc-corrected` file to visualize the coverage across the genome (Figure 8). Comparing this to our background distribution of chromosome coverage, we can see that this is a clear outlier:
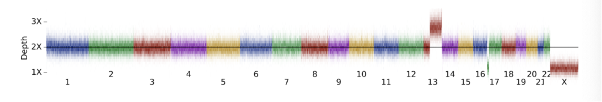
Data are represented as a heatmap with slices in the image representing the distribution of depth-bins (from .target.counts.gc_normalized file) at 100kb genomic intervals.
In the Figure 8 above, we can see a very large duplication on chromosome 13 as well as a large terminal deletion on chromosome 17, suggestive of an unbalanced translocation. Moving on to the CNV calls (Table 3), we can see the deletion represented in a single LOSS call, while the duplication is split across 5 separate calls. This splitting is due to the presence of common copy number variation or noise splitting the variant call into pieces as is common for such large CNVs.
Table 3: Subset of CNV.VCF file for NA20533 corresponding to CNVs adjacent to an unbalanced translocation.

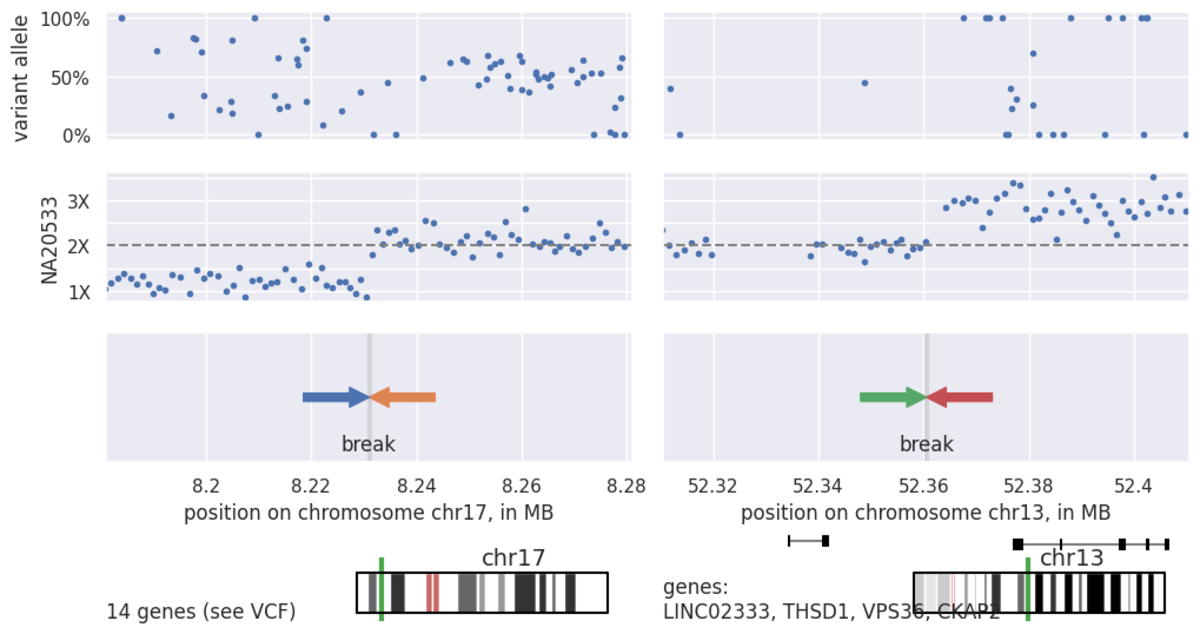
Dots represent normalized, binned coverage data from the `.target.counts.gc_normalized` file.
Seeing this coverage data, gives us confidence that we do indeed have a good estimate of the breakpoints on this unbalanced translocation. Finally, as we know that these translocations result in a genomic rearrangement as well as a copy number change, we can interrogate the structural variant call file, `.sv.vcf.gz`, near our CNV defined breakpoints for evidence of this variant via paired and split-read data (Table 4):
Table 4: VCF record for translocation breakpoint in NA20533.
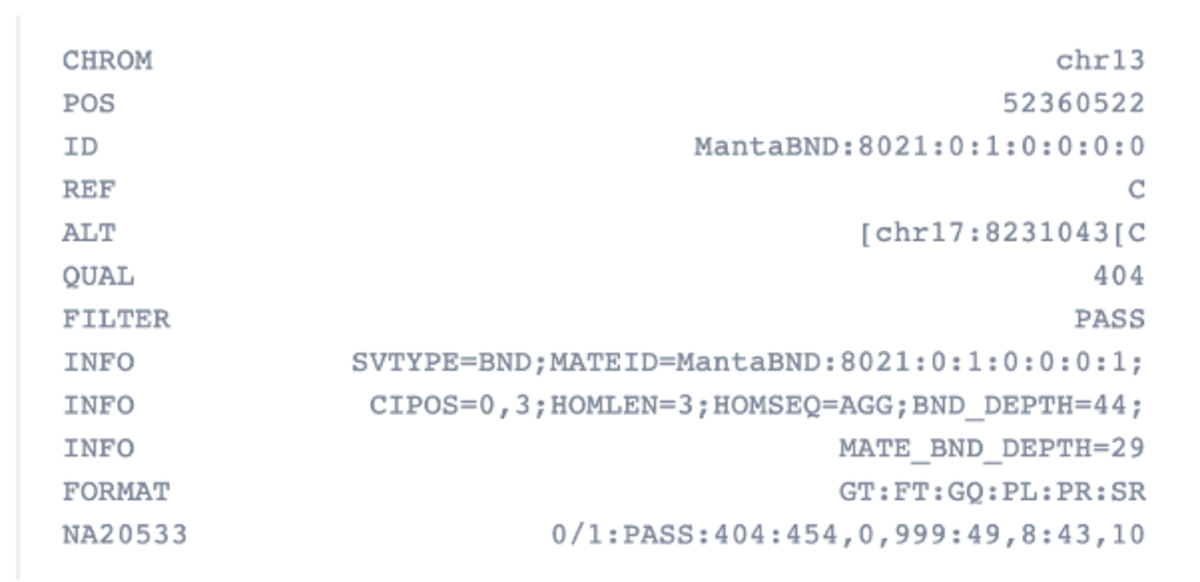
This example shows how the DRAGEN pipeline facilitates viewing of a rare large variant across many scales and allows us to observe the genome from the perspective of both read depth and split reads. With the CNV caller and associated coverage data, we get very reliable calling and clear interpretation of variants, while with the structural variant caller we get breakpoint resolution and an understanding of the mechanistic formation of this particular genomic rearrangement.
IV) Accuracy of Small Variant Calling
To unify the variant representation across samples and enable cohort analyses, we used the gVCF Genotyper component of the Illumina DRAGEN (Dynamic Read Analysis for GENomics) Bio-IT platform, version 3.6.3.
gVCF Genotyper takes the small variant caller output from each sample in a cohort and genotypes all variants seen in any sample across all cohort members. Samples that do not have a particular variant have their homozygous reference confidence estimated from depth information present in the small variant caller output, but gVCF Genotyper does not otherwise attempt to adjust genotypes based on information from the population. The output is presented in the standard multi-sample VCR15 format and can be used for downstream cohort analyses.
We release its output in the form of a cohort call set comprising of 2,504 samples from the 1000 Genomes Project, with variants genotyped across all samples and annotated population frequencies. The per-sample small variant calls used to build this call set were made available in a previous release.16
We demonstrate the high quality of the resulting data set by comparing against a call set generated independently with the widely-adopted GATK Best Practices workflow17 for germline small variants.
Scalable Cohort Calling with DRAGEN PopGen Pipelines on the 1000 Genomes Project data
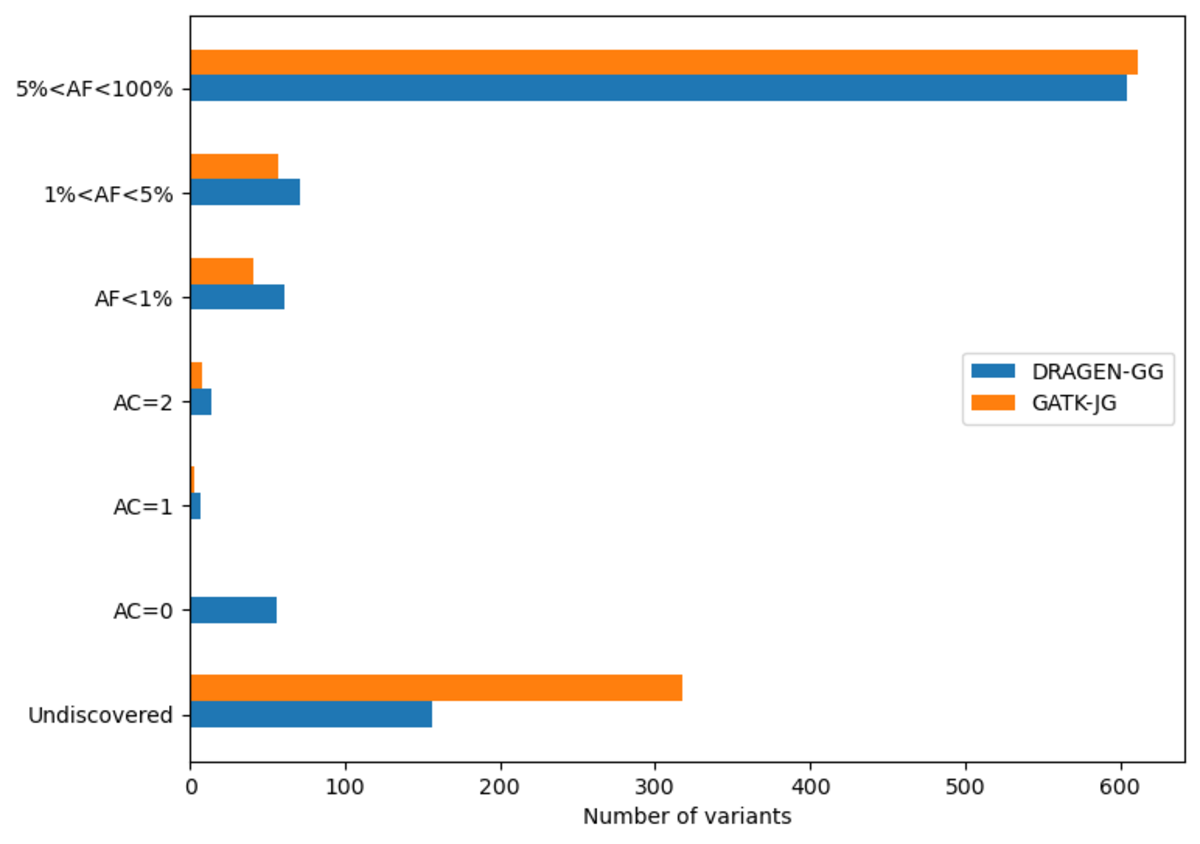
The DRAGEN cohort release consists of a multi-sample VCF for each chromosome, containing 2,504 unrelated samples. Across the whole genome, the data set contains 151 million sites in total, with 138 million SNPs and 18 million INDELs. It is worth noting that unlike other variant callers, DRAGEN outputs candidate alleles for which there is some evidence, but that do not get called with high enough confidence . Hence, a fraction of the sites in the output have allele count (AC) 0 with some of the remaining sites containing both alleles with AC=0 and called alleles. The potential value of these alleles is shown below in Figure 13. If desired, they can be removed with the following command:
bcftools view -a {in.vcf.gz} | bcftools filter -e 'ALT="."' -Oz -o {out.vcf.gz}
Excluding records with AC=0, there are 127 million sites, with 114 million SNPs,15 million INDELs and 8 million multiallelic variants. By comparison, the analogous GATK call set contains 120 million sites, with 108 million SNPs, 12 million INDELs and 9 million multiallelic variants. Figure 10 shows the distribution of these variants across the allele frequency spectrum, revealing that DRAGEN calls notably more rare variants – there are 13 million more variants with frequency below 5% in the DRAGEN output.
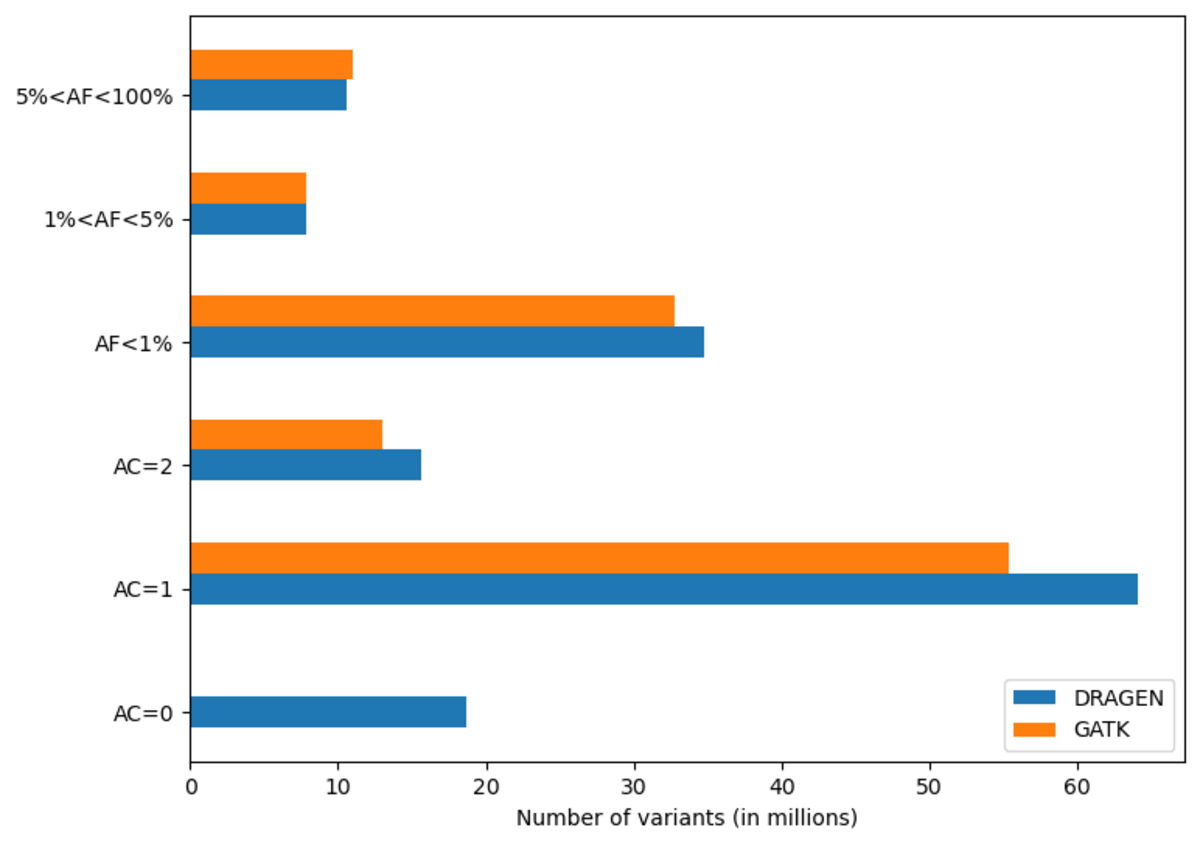
Note that full call sets were used for this figure – GATK would contain less variants after VQSR filtering.
DRAGEN Cohort Calling Accuracy
We benchmarked the accuracy of the population call sets obtained with DRAGEN and GATK using a variety of metrics: error rates against variant truth sets, departures from Hardy-Weinberg equilibrium and Mendelian violations in trios.
Error Rates
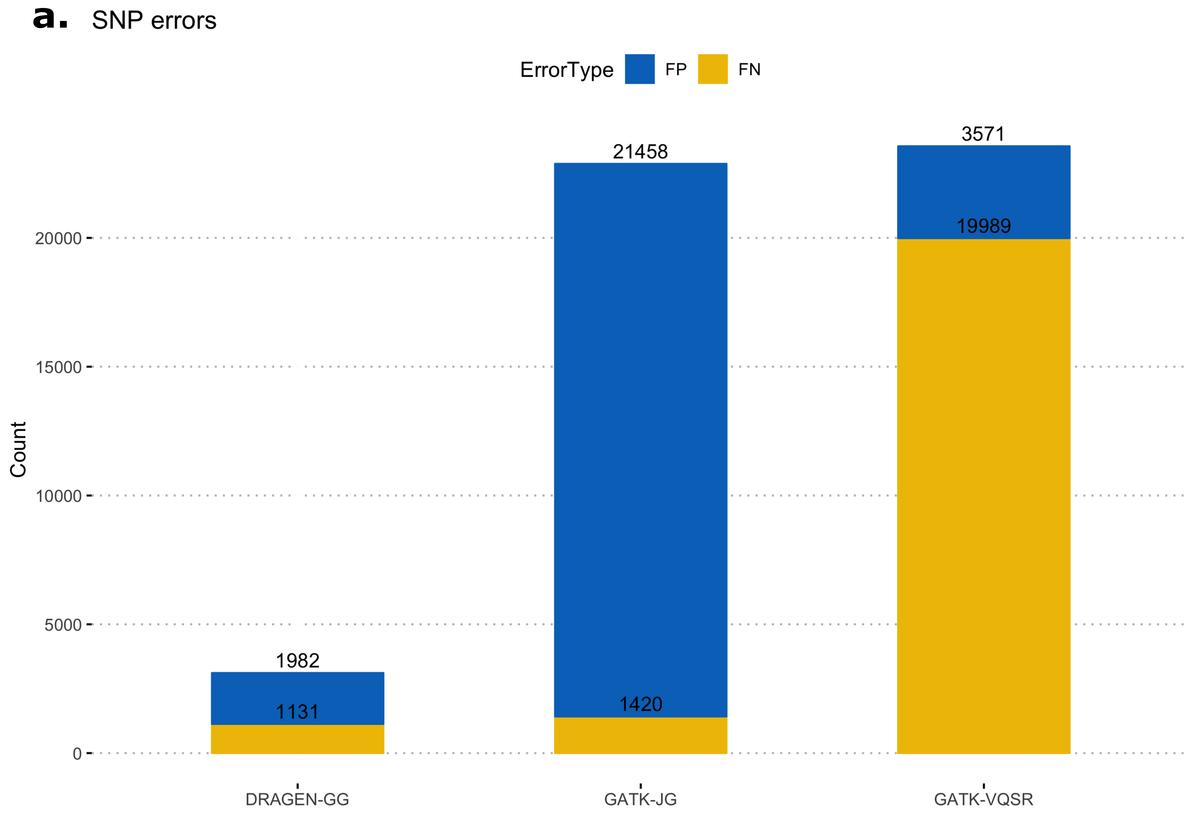
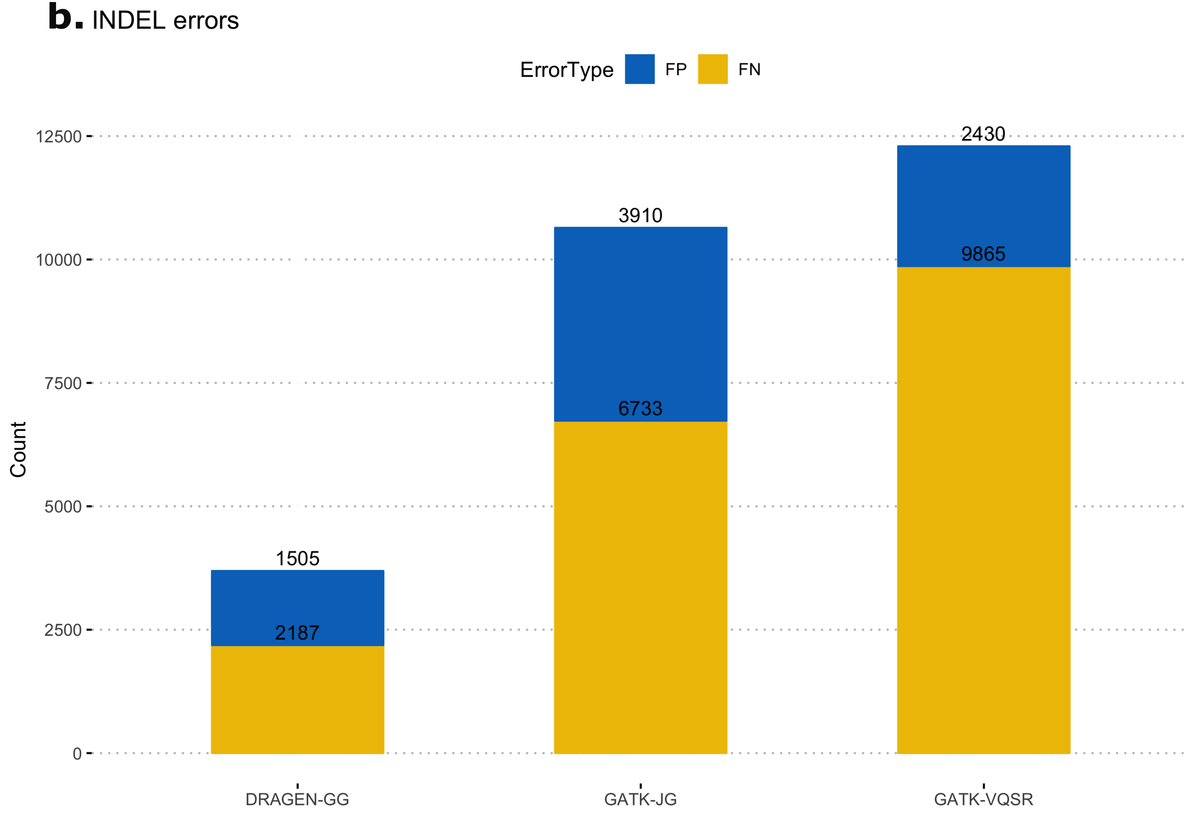
First, we calculated false-positive/false-negative counts in a well-characterized sample with truth variants, released by the NIST Genome In a Bottle (GIAB18) consortium. This truth sample, known as NA12878, was part of the original 1000 Genomes Project cohort. The column representing NA12878 was extracted from the multi-sample VCF and variants were compared to the truth set, using high-confidence regions from version 3.3.2 of the NIST dataset. Figure 11 shows resulting error counts from the DRAGEN calls ("DRAGEN-GG") and 2 call sets from the GATK output: with all variants after Joint Genotyping ("GATK-JG") and with variants that passed variant quality score recalibration only ("GATK-VQSR"). DRAGEN-GG has the lowest number of false positives and false negatives across both SNPs and INDELs.
Deviation from Hardy-Weinberg Equilibrium
Next, we measured deviations from Hardy-Weinberg equilibrium to compare the proportion of sites showing signs of artifacts in each call set. GATK VariantAnnotator was used to calculate the ExcessHet metric (excess heterozygosity) for each site, representing the Phred-scale p-value for the Hardy-Weinberg equilibrium test. Higher values mean higher chance of technical artifacts. Figure 14 shows the DRAGEN data set has the highest proportion of sites that do not violate the Hardy-Weinberg equilibrium, highlighting the high precision of its calls. We flag for filtering sites with ExcessHet > 28.69, whose p-value corresponds to being more that 3 standard deviations away from the Hardy-Weinberg expectation. This results in just under 0.05% of DRAGEN sites being flagged. We provide this information in a sites-only VCF file accompanying the DRAGEN cohort calls, which includes the ExcessHet metric, together with other commonly calculated site annotations. If users prefer to have all the information in a single file, they can merge the DRAGEN output and the sites-only VCF with the following command:
bcftools annotate –a {sites.vcf.gz} -c INFO,+FILTER –Oz –o {output.vcf.gz} {dragen_calls.vcf.gz}
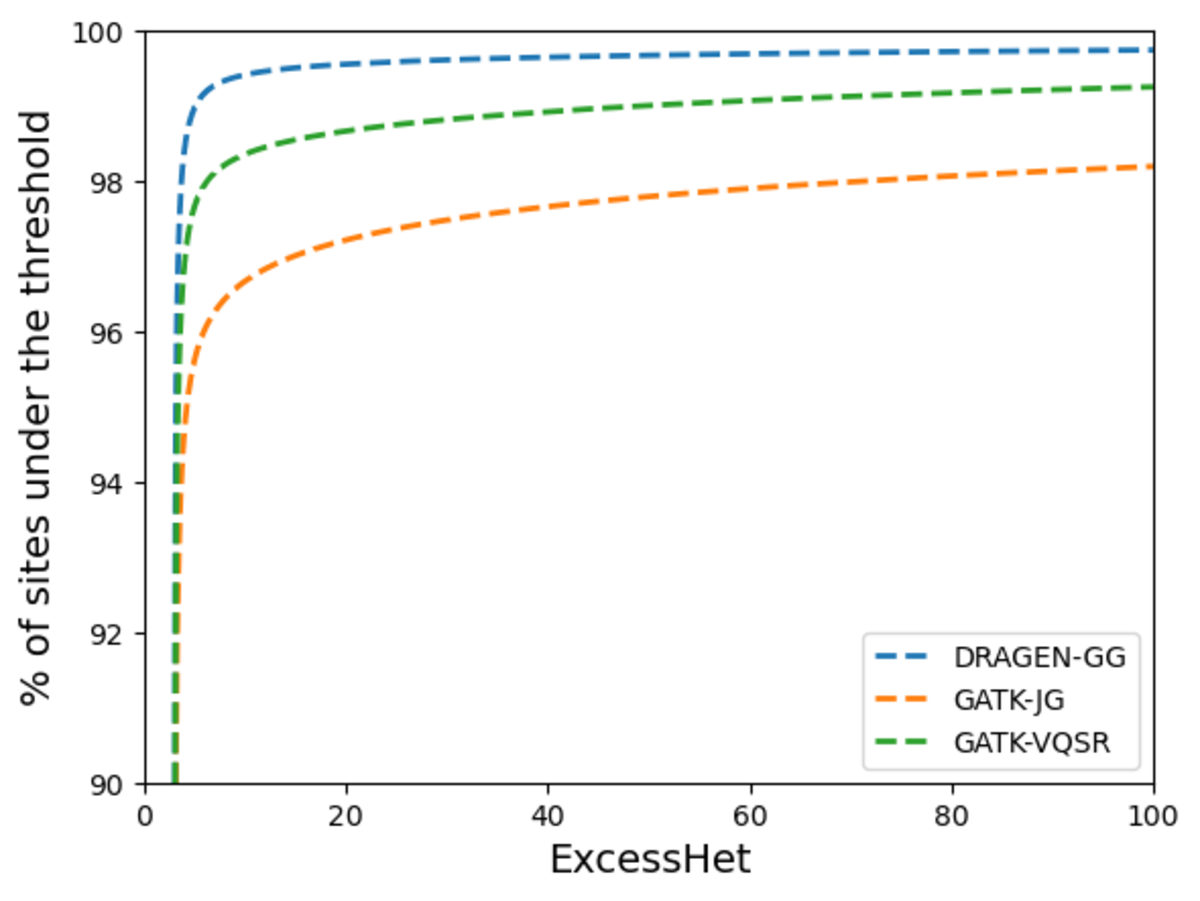
The higher the value, the more chance of technical artifacts when samples are unrelated.
Mendelian errors
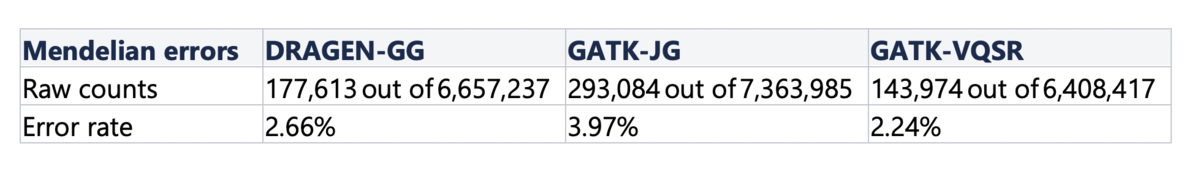
Finally, we computed Mendelian error rates in a hidden trio that was part of the cohort - samples NA20891, NA20882, NA20900. Violations of family relationships are a useful metric for assessing accuracy more widely than with truth sets, because they are not restricted to variants within the high-confidence regions of the genome. Table 5 shows the number of Mendelian errors over the total number of sites that are variant in at least one member of the trio. DRAGEN-GG and GATK-VQSR perform similarly, with a slight advantage to GATK-VQSR at the cost of making less calls overall.
Table 5. Mendelian Error Rates per Pipeline
Acknowledgements: Thank you to Shyamal Mehtalia, Egor Dolzhenko, Christopher Saunders, Heidi Norton, and Rami Mehio for their involvement and support in the tests presented in this article, for its review and for making the data accessible.
For more information or a DRAGEN trial license for academic use, please contact dragen-info@illumina.com.
External Links
https://github.com/Illumina/manta
https://github.com/Illumina/canvas
https://github.com/Illumina/ExpansionHunter
https://github.com/Illumina/SMNCopyNumberCaller
https://github.com/Illumina/gvcfgenotyper
https://github.com/Illumina/Cyrius
DRAGEN reanalysis of the 1000 Genomes Dataset on AWS
There are two ways of access the data: either through the AWS CLI or with AWS Management Console:
- With AWS CLI the user should enter aws s3 ls and then copy paste the links below.
- With the AWS Management Console the user will have to sign in to the Console and navigate to https://s3.console.aws.amazon.com/s3/buckets/1000genomes-dragen
Dataset links
Small variants 2504 samples:
Small variants NA12878 result:
CNV/SV 2504 samples frequency:
These datasets are explained in this AWS post:
References
- Marta Byrska-Bishop; et al. High coverage whole genome sequencing of the expanded 1000 Genomes Project cohort including 602 trios. bioRxiv 2021.02.06.430068
- Small variants 2504 samples.
- Small variants NA12878 result.
- Chen, X., Shen, F., Gonzaludo, N. et al. . Cyrius: accurate CYP2D6 genotyping using whole-genome sequencing data. Pharmacogenomics J (2021).
- Cyrius Article
- Chen, X., Sanchis-Juan, A., French, C.E. et al. Spinal muscular atrophy diagnosis and carrier screening from genome sequencing data. Genet Med 22, 945–953 (2020).
- SMA Article
- Illumina Connected Analytics
- Dragen reanalysis of the 1000 genomes dataset now available on the registry of open data. Figure 3
- Medhat Mahmoud et al. Structural variant calling : the long and the short of it. Genome Biology (2019)20:246 doi: 10.1186/s13059-019-1828-7
- Xiaoyu Chen et al. Manta: rapid detection of structural variants and indels for germline and cancer sequencing applications. Bioinformatics. 2016 Apr 15;32(8):1220-2. Doi: 10.1093/bioinformatics/btv710. Epub 2015 Dec 8. PMID: 26647377.
- Egor Dolzhenko et al. Detection of long repeat expansions from PCR-free whole-genome sequence data. Genome Res, 2017 Nov; 27(11):1895-1903. doi: 10.1101/gr.225672.117.Epub 2017 Sep 8.
- Egor Dolzhenko et al. ExpansionHunter: a sequence-graph-based tool to analyze variation in short tandem repeat regions. Bioinformatics, Volume 35, Issue 22, 15 November 2019, Pages 4754–4756. doi: 10.1093/bioinformatics/btz431
- Reviewer/Expansion Hunter Article
- The Variant Call Format (VCF) Version 4.2 Specification
- Dragen reanalysis of the 1000 genomes dataset now available on the registry of open data.
- Data Collections 1000 Genomes
- Genome in a Bottle