Introduction
As our closest living relatives, nonhuman primates have long been at the center of attention of genomics studies, driven by the desire to better understand human evolutionary origins, human health, and disease. We humans are primates ourselves, and thus understanding the similarities and differences between us and other primate species is a powerful tool to provide answers to these questions. There are currently more than 500 recognized primate species with unique morphological, physiological, and behavioral adaptations. These species inhabit several continents, including the Americas, Africa, and Asia, and have diverse social systems, diets, and habitats, making them important subjects for a wide range of scientific research. Despite the tremendous diversity primates exhibit, past studies have largely focused on a comparatively small number of species that are either particularly closely related to humans (such as chimpanzees, gorillas, and orangutans) or of importance to biomedical research (such as macaques). This narrow focus has severely limited our understanding of the true genomic variability contained within primate genomes. Additionally, for the sake of easier access they often include individuals who have been bred in captivity, which may result in estimates of diversity that do not reflect natural populations.
Understanding primate genetic diversity has become pressing for additional reasons: Currently, 60% of primate populations are threatened with extinction. Plummeting population sizes are mainly the result of anthropogenic factors such as climate change, habitat destruction, and wildlife trade and hunting. Studying primate genomes can help establish different metrics with relevance to conservation genomics, such as a baseline of genetic diversity and its determinants, the impact of inbreeding on genetic diversity, or fine-grained phylogenetic relationships between species or populations to identify local threats. Answering these questions requires large-scale sequencing of the genomes of many primate species and individuals, particularly those that have largely been neglected in the past, for example different species of lemurs in Madagascar, monkeys in the Amazon, or gibbons in Southeast Asia.
A deep catalogue of primate genomic diversity
We produced whole-genome sequences of 703 individuals from 233 different primate species, including 211 newly sequenced ones. We include representatives for almost half of all currently recognized species, and cover 86% of genera from all 16 families, representing by far the broadest taxonomic coverage of primate species to date (Figure 1A). This includes some of the world's most endangered primate species, such as the northern sportive lemur, which is estimated to have 40 individuals left in the wild. We assessed the evolution of genomic diversity as measured via heterozygosity across primates, and found it to span more than an order of magnitude in natural populations, from 0.41 × 10⁻³ to 7.14 × 10⁻³ heterozygote positions per base pair (Figure 1B, 1C).
While humans have the largest population size of all primates, we are one of the least diverse: We find only 15 other species with a lower median genetic diversity than humans, including several Asian colobines, the aye-aye, the western hoolock gibbon, and the Guinea baboon. There are large differences in genetic diversity across genera, families, and geographic regions, including examples of extremely high levels of diversity across guenons in mainland Africa. Several species in this tribe also exhibit large historical population sizes and include known instances of cross-species hybridization, which may drive high diversity. Other examples include several species of lemurs in Madagascar, which are among the most endangered species of primates, resulting from population decline due to rapid habitat loss.
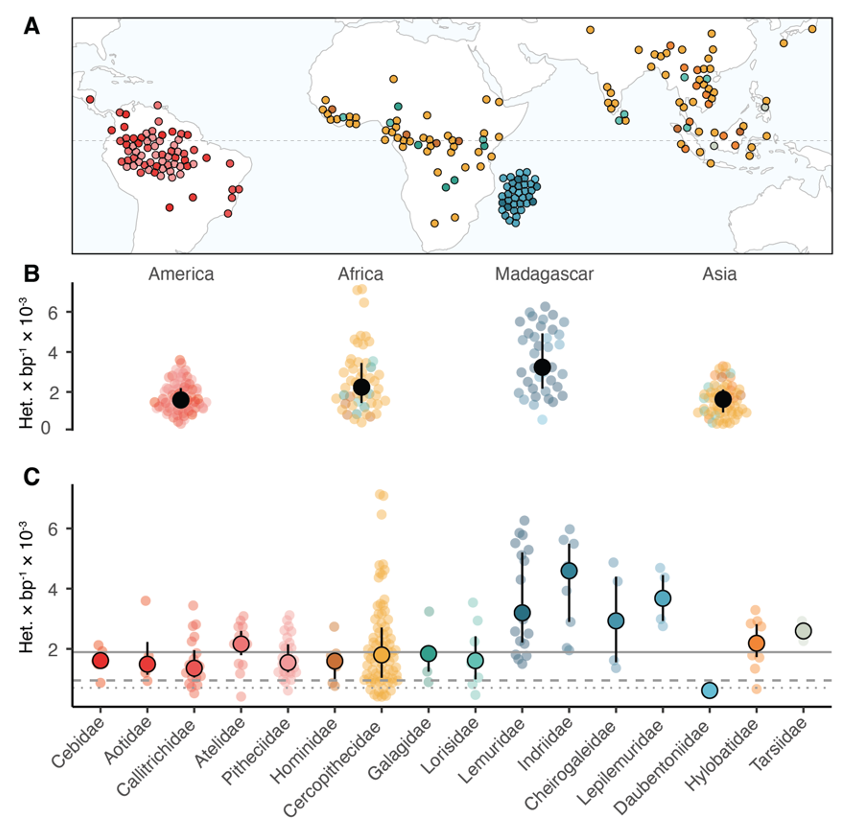
A: Approximate species range of all sampled species in this project with available data for species ranges. Points are repelled to avoid overplotting.
B: Heterozygosity stratified by geographic region. Solid black points and whiskers represent median values and interquartile range.
C: Median species heterozygosity by family. Solid circles and whiskers represent median and interquartile range. Solid gray line denotes primate-wide median heterozygosity, dashed and dotted lines denote human heterozygosity for African and bottlenecked out-of-Africa populations.
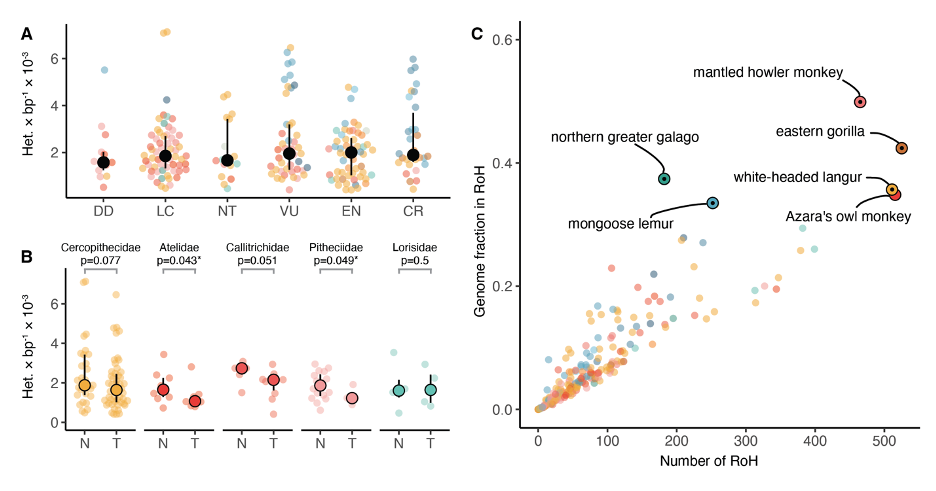
A: Relationship between IUCN extinction risk categories and heterozygosity. Solid black dots and bars denote median and IQR. DD = data deficient; LC = least concern; NT = near threatened; VU = vulnerable; EN = endangered; CR = critically endangered.
B: Partition into threatened (T: VU, EN, CR) and non-threatened (N: LC, NT) categories for all families with more than one species in either partition. Significant differences (p < 0.05, one-sided rank-sum test) are marked with an asterisk.
C: Median number of tracts of homozygosity versus median proportion of the genome in runs of homozygosity per species. Species with a fraction over 1/3 are highlighted. Solid black dots within highlights denote threatened species (VU, EN, CR).
Primate phylogenomics
We used thousands of genomic markers together with newly established fossil calibration points to generate the most complete genome-wide nuclear phylogeny of primates (Figure 3). We confirm the placement of all currently recognized primate families, tribes, and genera, and recover the interfamilial relationships within our phylogeny receive strong support except for the position of Aotidae, which remains uncertain.
Notably, we estimate the deepest split within primates between Haplorhini and Strepsirrhini to have happened between 63.3 million and 58.3 million years ago, and thus is younger than previously thought. We additionally leveraged our rich resequencing data to generate tree topologies that include multiple individuals per species wherever possible. Our results call several currently established species boundaries into question, as we find paraphyletic or polyphyletic placements of different individuals in 17 species, most of which are platyrrhines. This suggests that more taxonomic studies using genomic data are needed in this group to better define species boundaries, which have potentially important implications to define units of conservation. Finally, we retrieved previously unknown phylogenetic relationships for many species that were sequenced for the first time in this study, such as multiple different species of howler monkeys from the Amazon.
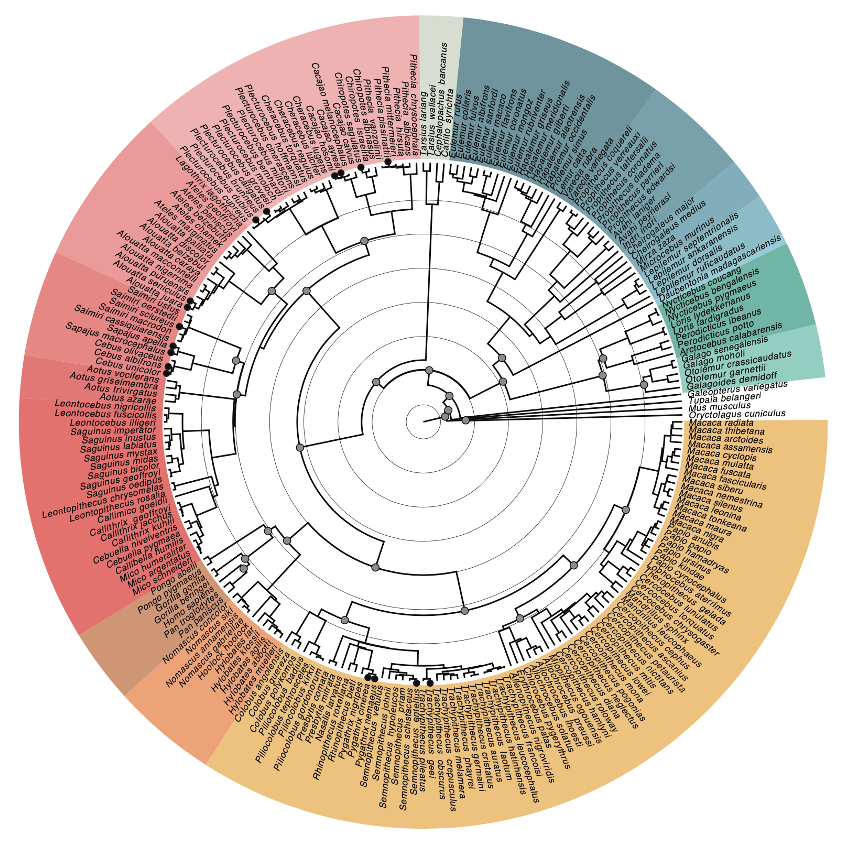
Concentric background circles mark 10-million-year intervals; solid gray circles in internal nodes show fossil calibration points. Species marked with solid circles at tips show paraphyly or polyphyly when including additional individuals to estimate the topology.
Reticulate speciation in Papio baboons
To better understand speciation in primates, we took an in-depth look at the genetic reticulation and population structure of different baboon lineages, using whole-genome sequencing data from 225 baboons representing all six species of the genus Papio and 19 geographic sites. Despite phenotypic and genetic differences, there is interspecies hybridization between different baboon species at several locations, mirroring the evolution of our own species. Our analysis of deep whole-genome sequences identified previously unknown locations of recent gene flow between genetically distinct populations. Notably, yellow baboons from western Tanzania showed genetic contributions from three distinct lineages, making them the first nonhuman primates to demonstrate this phenomenon. Comparing shared ancestry among individuals, estimated separately from the X chromosome and autosomes, revealed the directionality of recent gene flow, including a male-biased pattern. Interestingly, conspecific populations with identical phenotypes displayed varying levels of interspecies introgression. This indicates that population genetic structure and history among baboon lineages are more complex than expected based on phenotypic diversity and previous genetic studies, as single populations can harbor genetic contributions from multiple ancestral sources.
Determinants of diversity and mutation rate
To understand what factors influence diversity in primate species, we estimated their generational mutation rates based on their substitution rates via our dated phylogeny (Figure 4A). We found that our results aligned well with published estimates for overlapping species using trio sequencing, despite uncertainties because of the effect of selection, or uncertain dates of fossil calibration points (Figure 4C). Our findings revealed a wide range of estimated mutation rates per generation (μ) varying from 0.25 × 10⁻⁸ to 1.62 × 10⁻⁸, which is considerably larger than previously reported (Figure 4A). Among primate families, Lemuridae exhibited the lowest estimate per generation, while families like Cebidae and Lorisidae displayed highly variable estimates due to their variable generation times. The highest estimates of μ were observed in great apes. Furthermore, we discovered a significant positive correlation between μ per generation and generation time (Figure 4D), which partially counteracted the effect of generation time on the yearly mutation rate (Figure 4E). Species with shorter generation times exhibited larger yearly mutation rates (Figure 4F).
We used our estimates of genetic diversity and mutation rates to estimate effective population sizes (Ne) (Figure 4B). We identified multiple lemur species from different families and several guenon species with the largest Ne estimates, likely surpassing their census sizes. Additionally, certain species of Cercopithecus and Eulemur exhibited high Ne values, potentially driven by interspecific hybridization. Conversely, great apes, lorises, and platyrrhines displayed comparatively low Ne estimates. We observed a significantly lower mutation rate for species with higher Ne, providing support for the drift-barrier hypothesis, although conducting a formal test is difficult due to covariation between substitution rates and effective population size along the branches of the phylogeny.
To understand which additional factors influence genetic diversity and mutation rates, we analyzed 32 traits encompassing various aspects of primate biology. Using phylogenetic models, we identified important predictors of diversity within mating systems, activity budget, and climatic niche. For example, species organized in single-male polygynous mating systems showed lower diversity. We also found correlations between diversity and mean temperature, precipitation, and the amount of time spent socializing, although standardizing activity budget measurements across species and interpreting the relationship is challenging.
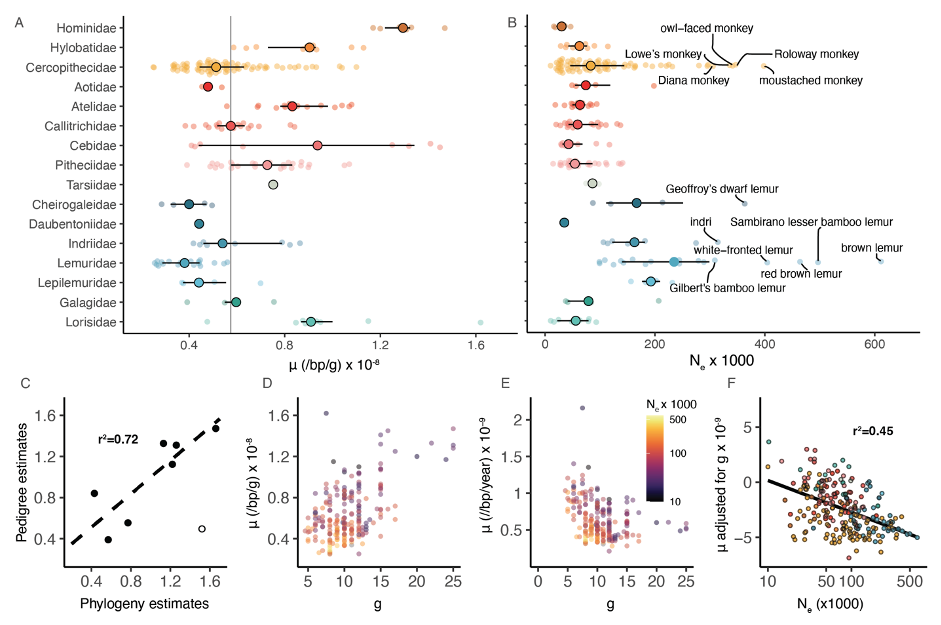
A: Distribution of estimates of the per-generation mutation rate across primate families (μ). Large solid circles denote median and horizontal bars denote the interquartile range. The gray line denotes the primate-wide median.
B: Distribution of effective population size (Ne) estimates across primate families. Species with Ne above 3 × 10⁵ are highlighted.
C: Comparison of pedigree-based estimates of μ show a high correlation between the two estimates (Spearman’s r = 0.85 p = 0.02).
D: Positive correlation between estimates of per-generation mutation rates and generation times (g) (Pearson’s r = 0.53, p = 2.1 × 10⁻¹⁷).
E: Inverse relationship between yearly mutation rate and generation time. Circles in D and E are colored by the effective population size Ne (Pearson’s r = -0.34, p = 3.1 × 10⁻⁷).
F: Relationship between per-generation mutation rate, adjusted by first regressing the effects of generation time, and effective population size. The relationship is highly significant after phylogenetic correction (r2 = 0.45, p < 0.001).
Unique variants in the human lineage
Lastly, we investigated the occurrence of amino-acid-altering changes that have previously been reported to be unique to the human lineage, and thus may in part explain the human phenotype. Searching for the same changes in other primates, we found that the majority of them recurred in at least one other species, suggesting widespread mutational recurrence across primates. Additionally, we identified a conservative set of missense coding mutations specific to the human lineage, some of which affected previously undescribed changes in genes, including genes associated with neurogenesis and the response to SARS-CoV-2 infection.
Furthermore, we generated a catalog of variants fixed across great apes but differing from rhesus macaque. Among these variants, we found mutations specific to the great ape lineage, significantly enriched in cilia-related functional categories. This suggests that the evolution of ape-specific features related to cilia has played a crucial role in shaping our species. Notably, we observed a higher proportion of genes with nonrecurrent ape-specific missense changes among genes associated with diseases, indicating a potential link between unique phenotypic traits and disease susceptibility.
In conclusion, our study provides insights into the determinants of diversity and mutation rate in primates. We identified various factors influencing these traits and uncovered unique genetic variants in the human lineage, shedding light on the molecular underpinnings of human distinctiveness.